Ridenour Center Of Gravity
Center of Gravity placement on a symmetrical bowling ball: How critical is it?
A hot topic on Internet forums recently has been the effect of center of gravity placement in symmetrical bowling balls. The two main pieces of evidence for this study are videos by Brunswick regional Professional Bowlers Association staffer Nick Smith, whose video can be found at brunswick.com and Lane #1 president Richie Sposato, whose video is at lane1bowling.com.
Those videos are effective visual evidence. For a more in depth look, the USBC research staff decided to use robotic ball thrower Harry to roll the balls.
This article will discuss the theory behind center of gravity effect on ball motion and will give preliminary conclusions observed from C.A.T.S. data.
When bowling ball companies design bowling balls in CAD programs, they usually have a certain pin to center of gravity distance in mind. Because of variation in the manufacturer’s process, USBC receives pin out distances that vary from 1 inch to sometimes 6 inches.
When bowling balls are marketed, the figures for total differential and radius of gyration are completed from the model of that particular ball on a CAD program. According the some ball manufacturers, the statistical numbers of a bowling ball can vary from the CAD numbers by about plus or minus 3 percent. The only way to truly measure those numbers once a ball is made is to use a radius of gyration swing such as the one USBC has to test bowling balls.
Once a bowling ball is drilled, those measurements taken before the ball was drilled will change, by also about plus or minus 5 percent depending on the drilling technique. If a weight hole was added to the ball to account for static weight, the total differential and intermediate differential of that ball will change depending on the size, pitch, amount of core material removed and placement of the hole.
An un-drilled symmetrical bowling ball only has one low radius of gyration point, and it has a high radius of gyration equator. That equator is present because the radius of gyration of both y and z axes are equal to one another. This does not apply to asymmetrical balls, for which the high radius of gyration spot is marked as the “mass bias” 95 percent of the time.
In addition to measuring the radius of gyration about the three axes, USBC research engineers also measured the radius of gyration about the positive axis point for Harry, which is 5 inches over by 3/8 inch up.
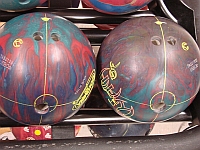
USBC used two Columbia 300 Wrath SF balls with 3 ounces of top weight and 2-2.5 inch pin to CG distances for the two test balls. The pin for both of these balls was located in the midline of the grip. The high RG equator was located through the thumb before drilling and after drilling both balls spun the exact same spot.
The only difference in the two balls was the center of gravity placement which was done at a 45-degree angle away from the midline. Photos of the balls are shown below.
Figure 1: Photos of the positive CG ball and negative CG balls used in the test.
The critical element of the experiment is the exact location for the pin because that will determine the starting radius of gyration measurement about the positive axis point. After properly drilling the two bowling balls shown in Figure 1, the numbers for the two balls are fairly similar. Measurements are shown below for both the positive and negative in Figure 2.
Figure 2: Post-drilling data from the two bowling balls.
The data from the graphs in Figure 2 are very close to one another. USBC experience has determined that the naked eye cannot distinguish the ball’s reaction from these balls alone. In addition to these figures, the top weights are relatively the same; the only substantial difference is that the positive CG ball has positive side weight of 1.25 ounces and the negative CG ball has negative side weight of 1.35 ounces.
The tests were all performed using Harry, rolling the balls at 17 mph and 375 rpm. The revolution rate was increased from the normal ball test to enhance the differences one would see in the reaction of these balls.
The standard 53-foot oil pattern used for the USBC Ball Motion Study was applied for an eight-shot test. That pattern is flat with about 30 units of oil at eight feet, 12 units at 32 feet and four to six units at 51 feet.
This type of alternating “ABBABAAB” test allows each ball a theoretically equal amount of oil time on the lanes. One eight-shot test was used as a break-in period for the two balls in the study.
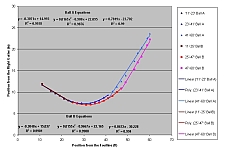
Figure 3: Ball motion data on the positive CG vs. negative CG ball.
Figure 3 illustrates the position graph from the C.A.T.S. data obtained during the eight-shot test. Each path represents an average of the four shots for that particular ball.
Ball A is the positive center of gravity ball, ball B is the negative center of gravity ball. It is worth noting that although the two graphs line up at the beginning with each other, the negative center of gravity ball takes four feet longer to start its hook phase compared to the positive center of gravity ball.
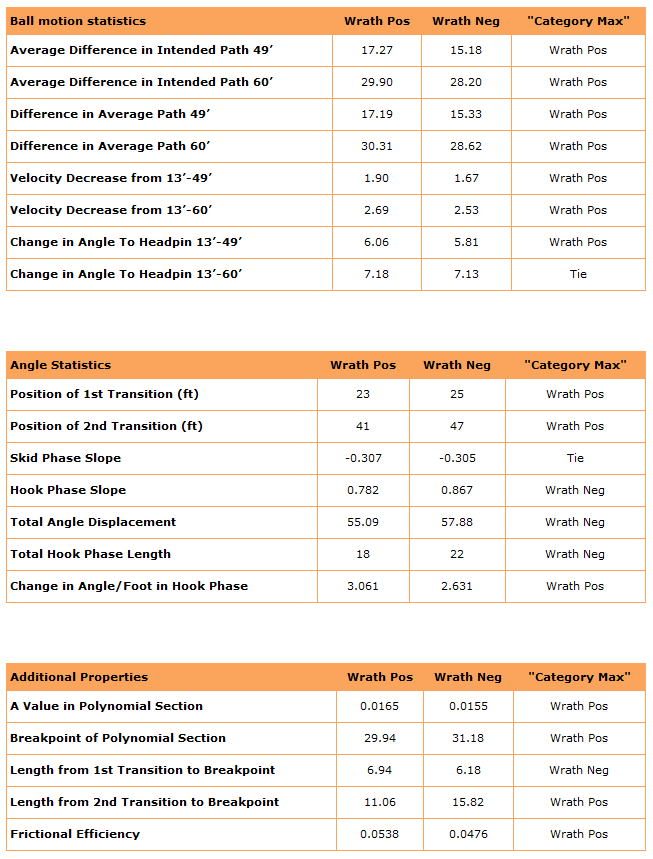
From the ball motion study, USBC studies 20 different variables in terms of ball motion, shown in the chart below. Notable on the chart is that the positive center of gravity ball was the maximum in 14 categories compared to four for the negative center of gravity ball with two ties.
Some key statistics from this test are that the positive center of gravity ball is two boards stronger on the back end in the oil than the negative center of gravity ball and the positive CG ball is a foot and a quarter sooner than the negative CG ball.
For a definition of these 20 Ball Motion Study variables, please see the Ball Motion Study Power Point presentation posted on bowl.com.
Figure 4: Ball Motion Study Statistics
It is worth noting that even though these are minor differences, they are still differences. Mathematically, the difference in position is roughly only about 10 percent; this is not always easy to tell on the lanes observing from 60 feet away. USBC had thought the balls looked very similar in reaction; however, the math paints a different picture.
Also realize that this is only one test, and that additional tests must be conducted to verify that these results are consistent for most bowling balls. USBC has performed some calculations to show that the static measurements of a drilled ball may affect between 3 to 8 percent of overall ball motion.
In Phase 2 of the USBC Ball Motion Study, static weight measurements are being added as an x, or static, variable. Since all balls are drilled the same in the ball motion study, static weights may not stand out.
That is why USBC has also prioritized an in depth static weight test to be completed after the study. This test should start in early 2008. The Ball Motion Study’s statistical analysis will investigate static weight’s overall percentage of influence over total ball motion. However, USBC’s concern is that the Ball Motion Study’s static weights will be too similar to see a real difference, hence another reason for the 2008 testing.
References
This article is courtesy of USBC.


