Difference between revisions of "Dual Angle Ratio Guide"
Trackbowler (talk | contribs) |
Trackbowler (talk | contribs) |
||
| Line 70: | Line 70: | ||
| − | [[Category: | + | [[Category: Layouts]] |
Revision as of 22:25, 22 April 2011
Contents
'joint effort from Elgavachon/Athery'
ratio discussion
Mo once told us "Determine the ratio of the angles to determine the shape of the ball motion. Axis rotation and axis tilt affect this decision a lot."
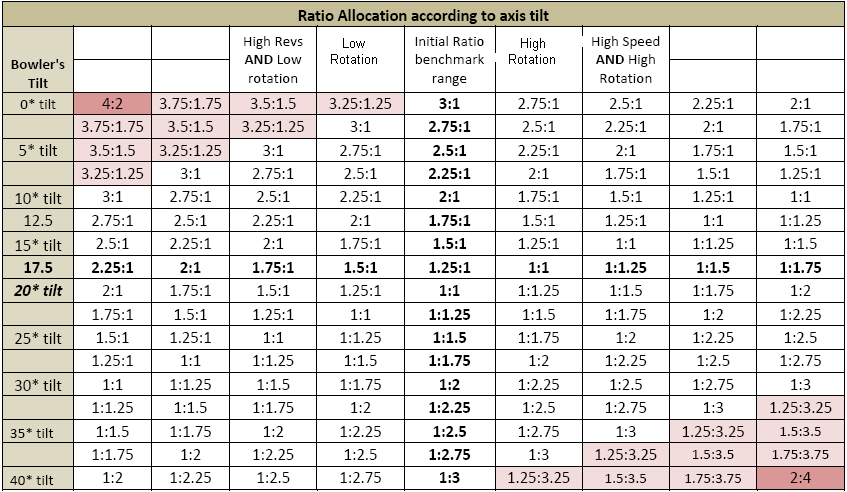
Mo more recently said " Once you decide on the ratio, the rest is math". Here is a chart Athery has done to help with finding the RATIO and a RANGE OF RATIOS to do that math.
to obtain approximations of ratios (based off various of Mo's recommendations)
After you have calculated the total sums and before you can calculate the benchmark or sweet sums, it is necessary to find the benchmark ratio.
This is necessary To accurately calculate the drilling angle and the val angle individually.
. The middle column (Initial Benchmark ratio) gives some examples of approximate ratios sometimes used by Mo for speed/revs matched + normal rotation.
- For in-between tilts not listed in horizontal columns, please see notes and examples at bottom of page.
- for tilts below 10*, please refer to chart at bottom of page for possible adjustments. (especially if low tilt is accompanied by higher rotation)
CHART IS BY ATHERY
speed or rev dominance and/or extreme high or low rotation
- In case of a conflict between speed or revs and rotation, go with the ratios which correspond to the rotation.
- You would adjust the #s based on the amount of dominance.
Extreme speed dominance and/or high rotation=decrease ratios.
(adjust to boxes further right on the chart)
Extreme rev dominance and/or low rotation= increase ratios.
(adjust to boxes further left on the chart)'
example # 1
20* tilt with speed and high rotation. The benchmark ratio will be 1:1.5 (see corresponding column on chart) with a ratio range 1:1 to 1:2 (range is an example only).
example # 2
20* tilt with revs and low rotation. The benchmark ratio will be 1.5:1 (see corresponding column on chart) with a ratio range of 2:1 to 1:1 (range is an example only).
Using 20* tilt as an example: Higher rotation with speed dominance will have moved the BENCHMARK RATIO from center column (2 columns to the right) or to the 1:1.5 RATIO box. If you wanted to use +or-.25 for your ratio range, go 1 box to the right and 1 box to the left from this RATIO box. You would have a RATIO RANGE of 1:1.25 to 1:1.75. Using the same example: If you wanted a +or- range of .5, go 2 boxes left and 2 boxes right from the chosen RATIO box and your ratio range is now 1:1 to 1:2. (Just an over-simplified calculation)
Another example would be a 10* tilt bowler speed/revs matched in center column has a 2:1 ratio. If you wanted a ratio range of +or- 1, you would go 4 columns to the right and 4 columns to the left and have a RATIO RANGE of 3:1 to 1:1 (see the for Ratio Ranges columns on chart)
A 10* tilt bowler who is up the back would have a 2.5:1 ratio on this chart so the for Ratio Ranges column on the left side of chart will show a ratio range of 3:1 to 2:1. The colored corners lets you know you are outside of the recommended 3:1 to 1:3 ratios.
Mo very seldom gives an extremely large ratio range. It is more common with very low or very high tilt. A +or- of around .5 above or below benchmark ratio seems to be close to average ratio range.
Further Notes
You need this ratio range to utilize in conjunction with your total sums to accurately calculate your sweet sums. Your ratio range would be used with the +or- total sums to mathematically calculate long pattern and short pattern layouts. Mo frequently uses the lower ratio range for control drillings for easy conditions or wet/dry. He frequently uses the higher ratio range for more challenging conditions.
Please note; These are our ideas for a basic starting place. You would adjust for specific balls,condition specific reactions,extreme conditions, etc. You would also adjust the numbers according to the amount of dominance (medium high rotation v.s. extremely high rotation) etc.
IN-BETWEEN TILTS
- To calculate for those tilts which fall in-between those listed in the horizontal columns, you would adjust the ratio .05* for every .5* of tilt* change. You would adjust both ratios in the RATIO RANGE by the same .05 amount.
example: 17.5* of tilt on speed/rev matched bowler with medium rotation=1.25:1 for the initial ratio (center column.) If you wanted to calculate for 17* of tilt on a speed/rev matched bowler with medium rotation, the initial ratio (center column) would now become 1.3:1. The ratio range at +or- .5 would have been 1.75:1 to 1:1.25 The new ratio range would now be 1.8:1 to 1:1.2
- PLEASE NOTE: On ratios less than 1:1, Mo sometimes expresses ratios with the val angle reduced to :1
EXAMPLE RANGE ABOVE of 1.75:1 to 1:1.25 would be expressed as 1.75:1 to .8:1 (.8:1=1:1.25, etc.)
With low tilt, the rotation seems to effect the ratios a lot more than with medium tilts. A high rotation will decrease them a lot (what Mo calls PDW territory) and a low rotation will significantly raise them. There is more of an extreme adjustment comparitively.
The ratios increase as the tilt decreases until you reach below 7*-10*. below that the ratios decrease. Part of the reason is because the maximum drilling angle is 90* and with low tilt, you need ratios which will take the ball down the lane.
Here is a sample of how to adjust the chart for low tilt:
